Power BI Sales Dashboard

Welcome to our Power BI Super Sales Dashboard, a powerful tool designed to transform your sales data into actionable insights. This dashboard leverages comprehensive sales data, providing a detailed analysis of key metrics such as sales, orders, and profit across various countries, products, and customer segments. With a focus on storytelling through data, our dashboard empowers businesses to identify trends, optimize performance, and make informed decisions.

hero section power bi dashboard

Elevate Your Sales Insights

In today’s data-driven world, the Power BI Super Sales Dashboard provides clear insights into sales performance. This tool was created to turn raw sales data into actionable insights, helping businesses succeed in a competitive market.

Key Features

line
Microsoft Power BI-Certified Custom Visuals
360° Sales Visibility
Centralize all sales data revenue, quotas, and performance metrics in one interactive Power BI dashboard.
Interactive Sales Analytics
Use Power BI filters, drill-through, and slicers to explore sales by region, product line, or customer segment effortlessly.
Custom KPI Tracking
Define and monitor your most critical sales KPIs like conversion rate, average deal size, and sales cycle length right in the dashboard.
Real-Time Sales Monitoring
Receive live updates on deals, orders, and KPIs so you can address issues and seize opportunities immediately.
Predictive Sales Forecasting
Leverage historical trends and AI-driven models in Power BI to forecast future revenue and demand with confidence.
Secure Role Based Access
Protect sensitive sales data with Power BI’s row-level security, ensuring each team member sees only what they need.

Tackling Challenges with Power Bi Sales Insights

line

Challenge

  • Organizations deal with high volumes of sales data from multiple sources: channels, regions, and product lines.
  • Many rely on spreadsheets and disjointed reports, making data analysis time-consuming and inefficient.
  • This lack of centralized data can cause:
    • Missed business opportunities
    • Ineffective resource allocation
    • Delayed reactions to market changes
  • Sales teams face difficulties in:
    • Identifying top-performing products
    • Pinpointing underperforming regions
    • Tracking shifts in customer behavior
  • Decision-makers lack a unified view of sales performance, hindering strategic growth planning.

Our Solution

  • A centralized, interactive platform built using Power BI.
  • Consolidates data from various sources into a single, real-time dashboard.
  • Offers intuitive visualizations like charts, graphs, and KPIs for:
    • Sales performance
    • Orders and profits
    • Year-over-year comparisons
  • Includes dynamic filtering for:
    • Regions
    • Categories
    • Customer segments
  • Enables drill-down analysis to uncover granular insights.
  • Helps businesses:
    • Identify trends and patterns
    • Discover hidden opportunities
    • Make confident, data-driven decisions
  • Transforms complex data into clear, actionable insights that drive growth and profitability.

Dashboard Pages & Navigation

line-rectangle
Super Store Overview
Overview Dashboard
Get a unified, real-time view of your business health on a single Power BI dashboard. Monitor total revenue, order counts, and profit margins at a glance. Use dynamic filters for date ranges and regions to dive deeper into performance trends or spot anomalies instantly.
Sales Analysis Report

Explore detailed sales trends by country, region, product category, and customer segment. Identify top-performing markets and under-leveraged products. With Power BI’s interactive filtering and drill-through, you can tailor your analysis to maximize sales growth and market share.

sales Order list
sales Order list
Sales Analysis Report

Explore detailed sales trends by country, region, product category, and customer segment. Identify top-performing markets and under-leveraged products. With Power BI’s interactive filtering and drill-through, you can tailor your analysis to maximize sales growth and market share.

Super Store Order
Order Analysis Report
Track your order lifecycle end to end. Review order volumes, average order value, conversion rates, and fulfillment efficiency. This page helps you uncover process delays or bottlenecks, so you can streamline order handling and improve customer satisfaction.
Profit Analysis Report

Understand where you make the most profit and where costs are eating into margins. Compare revenue versus expenses across segments, categories, and regions. Use these insights to focus on high-profit opportunities and implement targeted cost-control measures.

Super Store sales analysis
Profit Analysis Report

Understand where you make the most profit and where costs are eating into margins. Compare revenue versus expenses across segments, categories, and regions. Use these insights to focus on high-profit opportunities and implement targeted cost-control measures.

Super Store
Geographical Analysis Report
Visualize your sales performance across different locations using Power BI maps and regional charts. This report helps identify high-performing areas and regions needing attention—enabling smarter, data-driven decisions to grow market presence and profitability.

Key Insights 

line-rectangle
Trend Of Android Apps Development
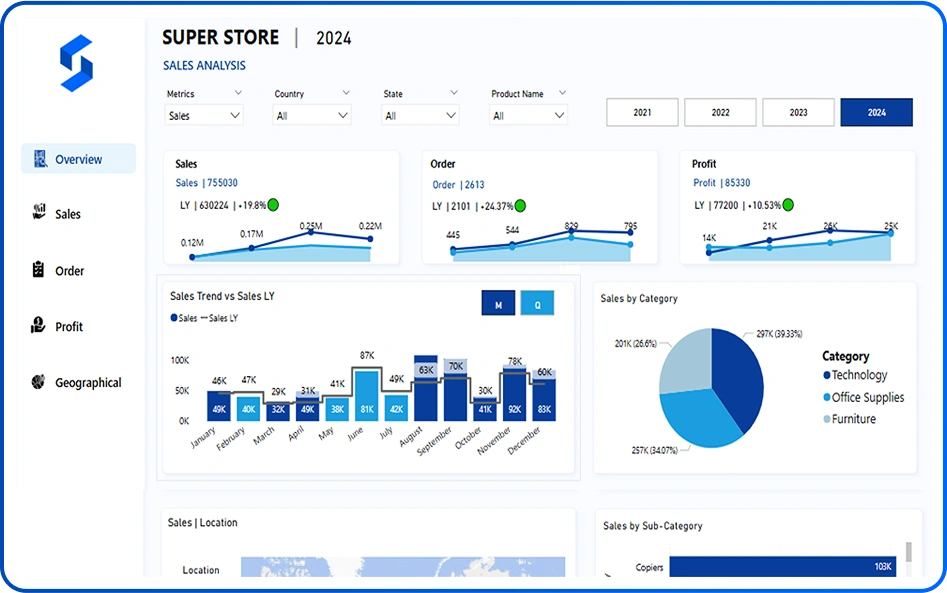
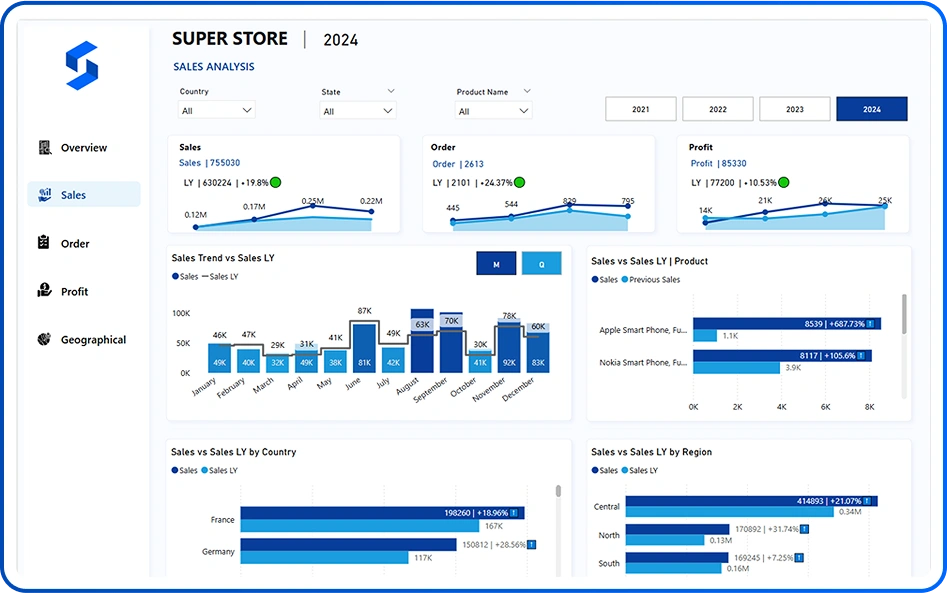
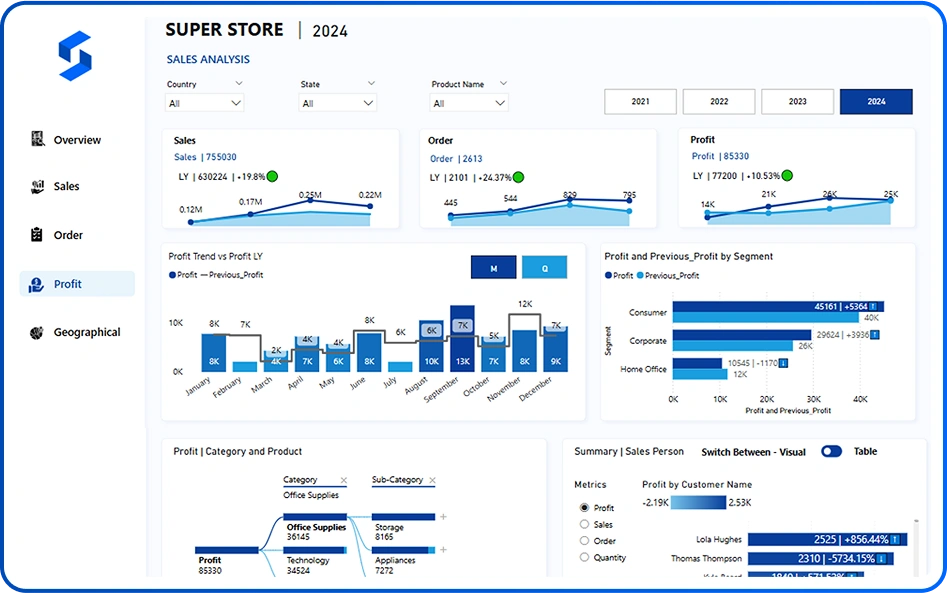
Top-Selling Products

Identify which products drive the most revenue and focus sales efforts where they’ll have the biggest impact.

Trend Of Android Apps Development
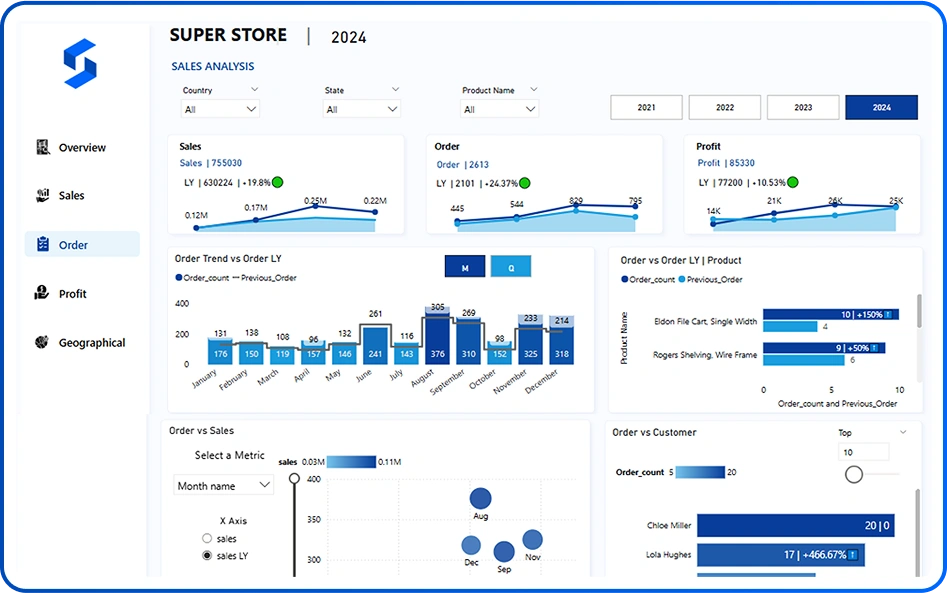
High-Potential Customer Segments

Pinpoint segments with strong growth potential to optimize resource allocation and outreach.

Trend Of Android Apps Development
Sales Growth Drivers

Discover what’s fueling revenue increases promotions, channels, or seasonal factors to replicate successes.

Trend Of Android Apps Development
Customer Purchase Trends

Track buying patterns over time to understand customer preferences, optimize inventory, and tailor promotions for higher conversions.

FAQs

Can it be customized for my business?

Definitely. We can tailor the dashboard layout, visuals, and metrics to match your specific sales goals and business needs.

Who can use this dashboard?

Sales managers, sales Representatives, business owners, and anyone looking to monitor sales performance in real time.

What is the primary purpose of a sales dashboard?

The primary purpose of a sales dashboard is to provide a visual representation of sales data, making complex information accessible and actionable for decision-making.

How often should a sales dashboard be updated?

Sales dashboards should offer real-time insights. However, the frequency of updates may depend on the specific metrics and the capabilities of the sales dashboard software.

Can sales dashboards be customized for different roles within the sales team?

Yes, the best sales dashboards allow for customization to meet the unique needs of various users, from sales reps to senior management, ensuring relevance and effectiveness.

How do sales dashboards integrate with other business tools?

Modern sales dashboard software is designed to integrate seamlessly with a variety of business tools, such as CRM platforms and email marketing software, to provide a unified view of sales data.

What are some key components of an effective sales dashboard?

Key components include real-time sales performance metrics, customizable views, sales analytics, user-friendly data visualization, scalability, and strong security measures.

Why is real-time data important in a sales dashboard?

Real-time data is crucial for making timely decisions based on the latest information, allowing sales teams to quickly respond to market trends and performance insights.

How can sales dashboards impact decision-making?

With sales dashboards, decision-makers get clear sales insights. It helps optimize strategies and enhance performance.